Why this note exists
The point of starting stringent was to show the gates operate cleanly where the data is easy before asking them to hold where it isn’t. Two things about the new cases break the assumptions the original gates were built on.
The numbers stop being counts. The National Survey of Children’s Health and the Youth Risk Behavior Surveillance System are complex-sample surveys. Their published values are weighted estimates with confidence intervals, suppressed below cell-size thresholds, and occasionally reset by an instrument redesign. A survey estimate is not a count you can re-tally from records; it carries uncertainty and provenance that a count does not.
The levers stop having a date. Title V and ESSA accountability are continuous. The money has attached for years. There is no 2012-penalty moment to measure a number against, the way HRRP gave us one. The pipeline’s “did the number move after the lever?” engine assumes a point in time, and these levers don’t have one.
The clarifying principle, stated first
The house rule has always been “do statistics in code, not in the model.” That rule permits deterministic code to compute statistics all day; what is forbidden is the model doing arithmetic. The model only narrates numbers it was handed.
Bringing in survey data adds a second honest way a number can reach the page, and it is worth being precise that this is a tightening, not a loosening. Record-derived values are computed deterministically in the warehouse from raw records; these are the original six panels. Published-estimate values are ingested verbatim from the agency’s own published table, confidence interval and all, and never recomputed.
Both are honest, and neither is the model doing math. For a weighted survey estimate the second is the more conservative choice: rather than re-implement replicate-weight variance in DuckDB and ask the reader to trust our arithmetic, we stand strictly downstream of the official statistic. The grounding gate — which today whitelists a number only if it traces to a bar or a registered figure — is extended to accept an official published estimate as a first-class value, tagged with its provenance class. Nothing about the model’s leash changes.
Survey-data mode: three gate revisions
1. Ingest-not-compute provenance tier. Every value now carries a provenance class, record-derived or published-estimate. The grounding gate accepts both; the export records which. A published estimate arrives with its confidence interval, and the interval is a first-class value the note may cite. This is the primitive that makes NSCH and YRBSS panels possible without writing survey-variance code we’d then have to defend.
2. Suppression as a cell state. A survey cell is one of three things: present, suppressed (below the disclosure threshold), or missing (the state didn’t field it). It is never zero, and zero is never allowed to stand in for either of the other two. A new gate fails the build if a suppressed or missing cell renders as a number or as a bar of height zero. Small cells at state by race by poverty-band are the rule rather than the exception, so this gate earns its keep immediately.
3. Version crosswalk. When an instrument is redesigned, series that cross the redesign are not comparable. NSCH’s 2016 redesign is the worked example: any flourishing chart that spans 2016 is simply wrong. The extension track enforces this structurally: the warehouse ingests only from the current instrument version onward (raw_flourishing_ext starts at 2016), so a series cannot cross an instrument boundary because the pre-boundary data is not present. Registering a documented crosswalk before extending the warehouse back across a boundary is the discipline; promoting the check to a runtime assert that would fire on future ingest attempts is on the near-term roadmap. Same discipline applies within-series for item drift: if an item’s wording or response options changed between releases, pooling across the change is disallowed until the change is disclosed. The crosswalk is the semantic layer that keeps two differently-worded instruments from being silently averaged into one trend.
Comparison honesty: three more gate revisions
4. Definitional-variance layer. A cross-unit comparison is blocked unless a reconciliation table travels with it. This is the primitive the chronic-absenteeism case exists to demonstrate: two states’ rates may not sit on the same axis until a table underneath the chart shows how each state defines the denominator. Where the definitions differ and aren’t reconciled, the comparison is refused. The reconciliation table is not a footnote under the chart — it is the chart.
5. Lever typing. A lever is now typed as point-in-time or continuous. The timing gate — the one that checks a number moved after its lever, not before — runs only on point-in-time levers and is marked explicitly not-applicable on continuous ones. This replaces the quiet dishonesty of inventing a pre/post for Title V just because the gate wanted a date. Naming the lever type is itself a finding the page should state.
6. Uncertainty-aware “did it move?” The NAEP panel already forces the note to say that a one- or two-point move isn’t statistically distinguishable from noise. That logic generalizes: when a value carries a confidence interval, a change whose intervals overlap is reported as “not distinguishable,” full stop. The significance check stops being a NAEP special case and becomes a general CI-overlap caveat every survey panel must disclose — enforced by the required-caveats gate, which fails the build if the mandated significance phrase is missing from the panel’s movement note.
Implementation note: shapes of enforcement
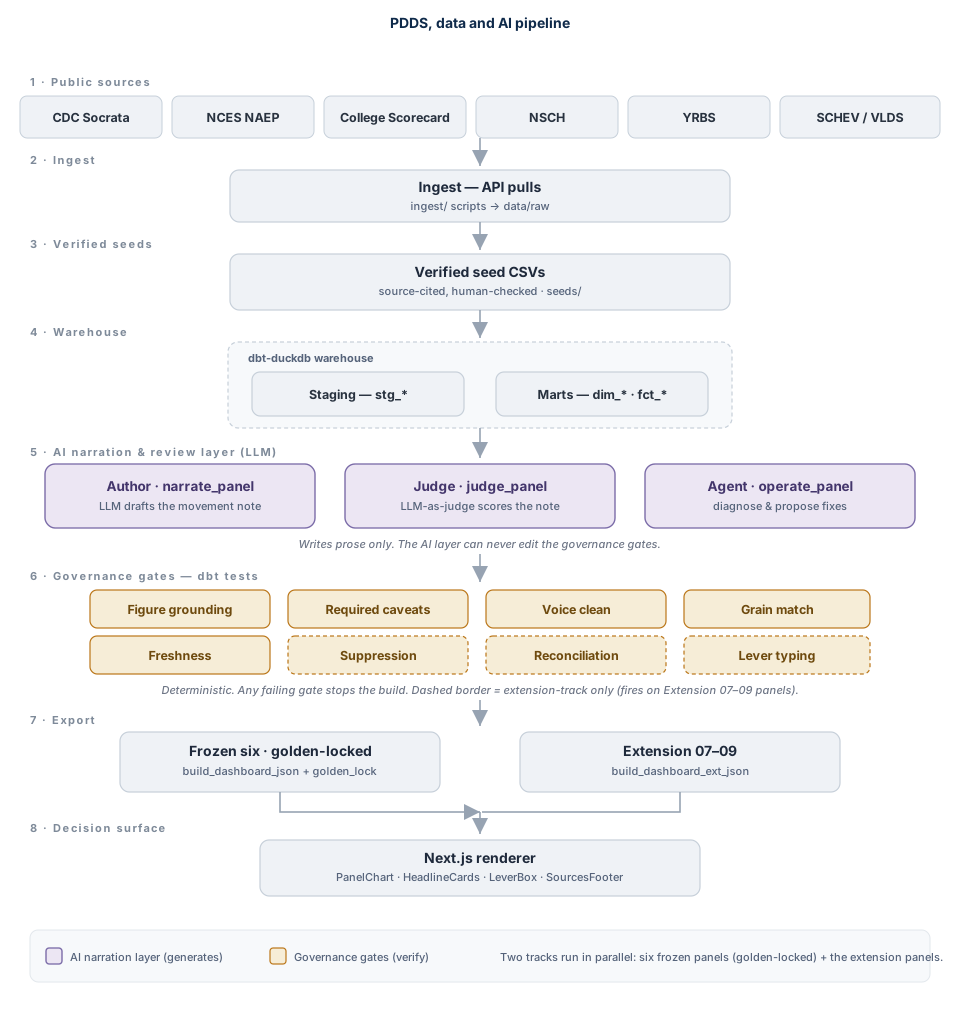
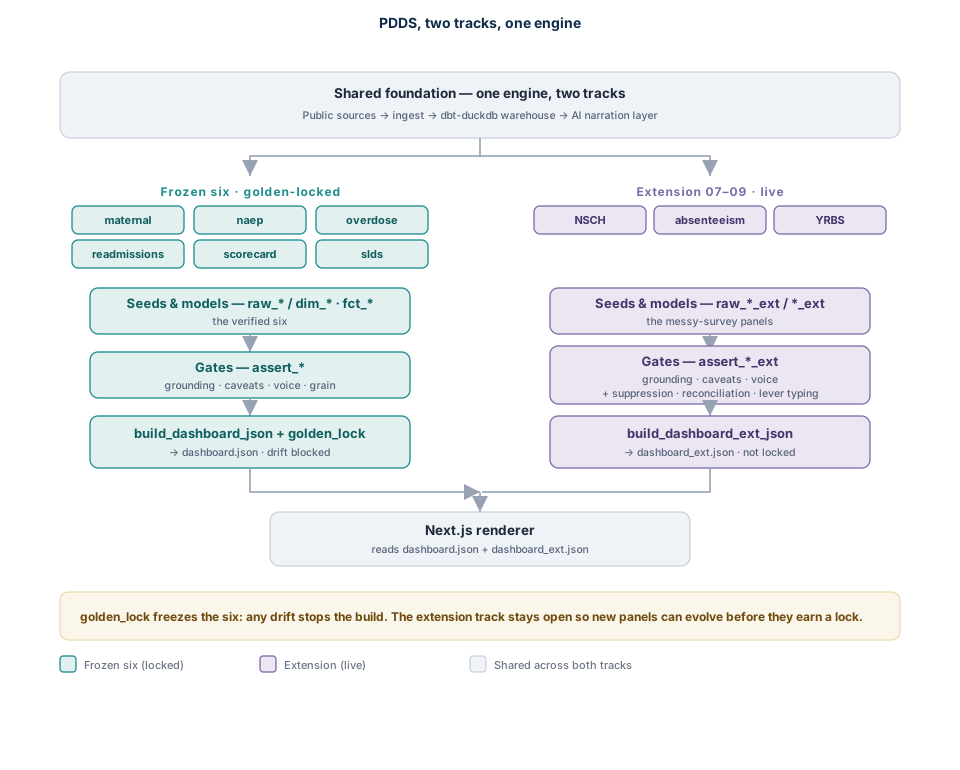
These revisions differ in shape, and the difference is worth naming. Three ship as new discrete gates on the extension track (assert_suppressed_never_zero_ext, assert_cross_unit_reconciled_ext, assert_lever_typing_ext) — any failure stops the build. The CI-overlap check (gate 6) is enforced inside the required-caveats gate as a mandated disclosure: the panel’s movement note must carry the significance caveat, or the build fails. It is a disclosure gate, not a numeric-comparison gate — and for a public dashboard, the disclosure is the point. The provenance-class distinction (gate 1) is a data-structure primitive underneath the extension track (raw_*_ext vs raw_*). Version crosswalk (gate 3) is enforced structurally: the extension warehouse only ingests from the current instrument version onward, so a chart cannot cross a boundary because the pre-boundary data is not present. Promoting the crosswalk to a runtime assert that would fire on future ingest attempts is on the near-term roadmap. All six are inspectable in the repo; the shapes differ on purpose.
The worked case: chronic absenteeism, New Jersey first
Chronic absenteeism is the strongest construct to carry these revisions, for the same reason HRRP is the strongest panel already on the page: it is a Goodhart case with money and consequences attached, and it is reported at school and district grain, which is finally the grain communities actually decide at. The share of students absent 10 percent or more of enrolled days sits inside most states’ ESSA accountability systems as a School Quality / Student Success indicator. Once an indicator sits in an accountability system, its reported value can move through definition, coding, or enrollment practice rather than through student behavior. That is the whole exhibit.
Within New Jersey is the anchor. A within-NJ trend, over years where NJ’s own definition held constant, is the primary chart. This is the one comparison that needs no reconciliation layer, because the denominator is the same on both ends. Where NJ changed its own definition mid-series, the break is shown rather than smoothed.
Neighbors come second, and only gated. New York, Pennsylvania, Delaware — a comparison to neighboring states is allowed only with the definitional-variance layer (gate 4) attached, because the federal reporting itself calls these definitions inconsistent across states. Each state’s denominator rule (enrolled days versus membership days, the minimum-enrollment cutoff before a student counts, treatment of mid-year transfers, excused versus unexcused) is shown beside its number. If we can’t assemble the neighbors’ definitions from published state documentation, the neighbor comparison ships narrower or not at all; the within-NJ panel stands alone regardless.
Private schools are outside the frame — say so. EDFacts and state report-card collections cover public schools; private schools don’t report into these accountability systems, so they are structurally absent from the data. That’s a stated exclusion rather than a silent drop.
Charter versus traditional-district is available but confounded. New Jersey reports charter schools, so the breakout exists and cell sizes usually permit it. Charters and district schools serve different populations, so a raw charter-vs-district gap is a composition difference at least as much as an attendance difference. The two are shown adjacent with that selection caveat stated plainly; we never compute or headline a “charters do better/worse” claim from it. Same discipline as gate 6: show them side by side, don’t subtract what isn’t defensibly subtractable.
The pandemic years break the series. 2020–21 and 2021–22 attendance-taking under remote and hybrid instruction is non-comparable to either side. The break is shown; it is never interpolated across.
What this panel set must still refuse to claim
A falling chronic-absenteeism rate does not mean students are attending more, absent evidence that the definition and coding practice held constant. A cross-state difference reflects how each state defines the number at least as much as it reflects policy quality. A charter-vs-district gap reflects who enrolls where before it reflects any school effect. And none of this pushes down to community grain: the best national flourishing instrument publishes at state grain, and the only child indicator that reaches school grain is the one with accountability money attached and no stable cross-state definition. That gap is the argument.
Status and provenance
This note documents how the gates were revised, not any finding about New Jersey or any survey. The construct definitions, the specific state absenteeism rules, the NSCH item wording and pooling guidance, and the current YRBSS item inventory are all verify-flagged and belong to the build thread. Nothing here should be read as an established fact about a data source.
The operating ethos it records is deliberate: stringent cases first, then slightly messier ones, with every gate revision named in public rather than quietly relaxed. The point of PDDS was never that the data is clean. It is that when the data gets dirty, the wall gets documented rather than lowered.
Written July 2026 as a method note from the PDDS project, documenting the first deliberate move from clean administrative counts and point-in-time levers into survey data and continuous-lever cases. The revisions are named in public so the discipline stays inspectable as the framework grows.
Questions, pushback, or a problem that looks like this one? Write to chai@analyticbytes.systems.