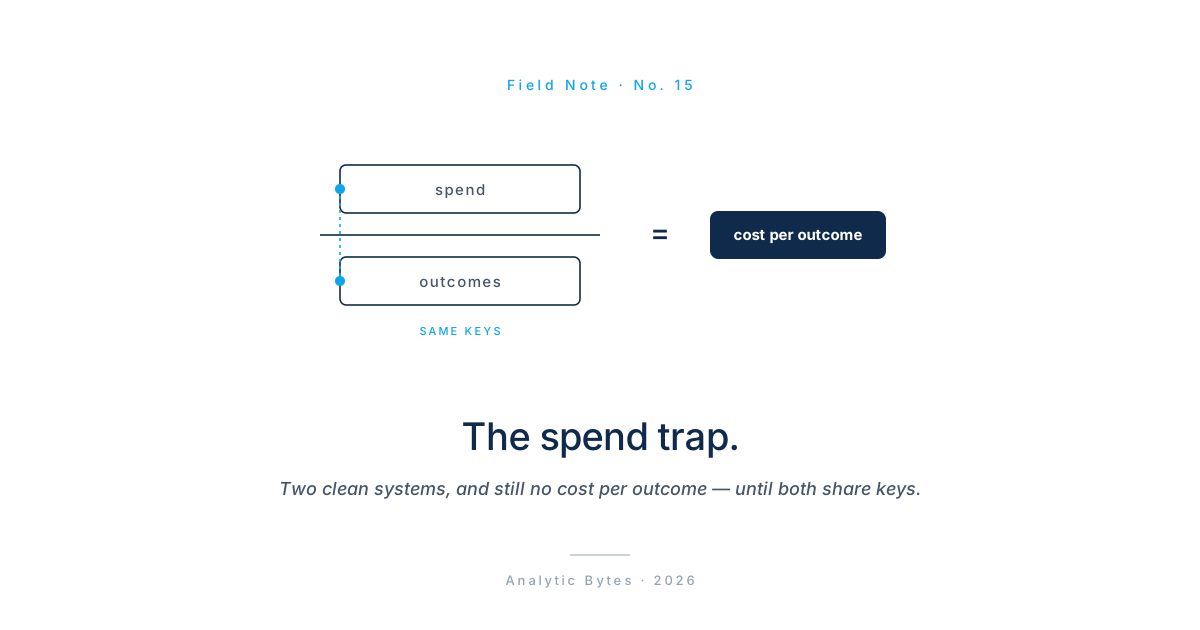
Spend is what falls out for free
Every finance stack pulls toward spend. Salaries paid, stipends cut, rent allocated, grants closed. These numbers are not wrong, and a nonprofit that cannot say what a program cost has a real problem. But ask why they are always the numbers you have. They are byproducts of transactions the organization was already recording for other reasons. The check cleared, so the cost is booked. The invoice posted, so the line exists.
Effectiveness is not a byproduct. No accounting system logs “and it worked” as a side effect of paying an invoice. Whether a program moved its outcome has to be built — the outcome defined, placed on a scale, counted the same way next year. Spend is recorded. Evidence is constructed. The first step out of the trap is to stop expecting the finance system to hand you the second thing for free.
Why the finance system can't save you
This is where most teams go looking, and it fails here. The instinct is reasonable: we just migrated to a real platform, it tags every transaction to a program, surely cost per outcome is one report away. A modern finance system is genuinely good at the numerator. Tag a transaction to a program dimension and you can isolate what that program spent, cleanly, across direct and allocated cost. That is a real and necessary job.
You can even bolt a statistical account onto the ledger and store an outcome count next to the dollars. Some teams do, and that can solve storage. It does not solve definition, comparability, or ownership — the work of saying what a placement is, keeping it comparable across programs that each describe success in their own words, and naming who governs the value. That work lives in the evidence spine, not the ledger. Location does not confer governance. Putting the outcome model where the dollars live is a storage decision, not a measurement one.
The overhead ratio is the shortcut everyone takes
Because spend is the number that falls out for free, spend-only ratios get promoted to stand in for effectiveness. The program-expense ratio — the share of the budget that reaches “programs” rather than “overhead” — is the clearest case. Easy to compute, feels like accountability, says nothing about whether a program worked. Two workforce programs can post the same low ratio while one places people in lasting jobs and the other places no one. The ratio never looked at the outcome; it only looked at the shape of the spend. The sector said this out loud years ago. In 2013 the three leading charity-information services (GuideStar, Charity Navigator, and the BBB Wise Giving Alliance) signed an open letter to the donors of America calling overhead “a poor measure of a charity’s performance” (The Overhead Myth, Nonprofit Quarterly, 2013). The argument is right and the reflex persists, for one reason: the ratio is free. The join is not.
What the join actually is
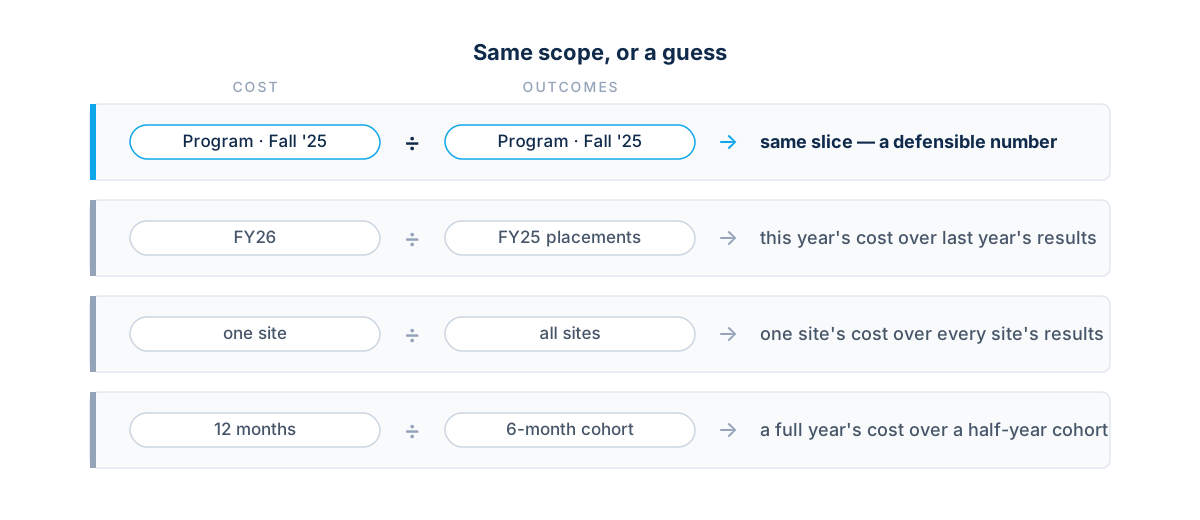
Cost per outcome is a division. A program-cost numerator over an outcome denominator. The arithmetic is trivial, and it is not the point. The point is that the two numbers have to describe the same slice of the world — the same program, the same cohort, the same site, the same period. That is a governance property, not a storage one. It comes from both systems agreeing, in advance, on one governed set of keys and writing every record against them.
Miss that and you get a division that looks fine and means nothing: this year’s spend over last year’s placements, one site’s cost over the whole program’s outcomes, twelve months of cost over outcomes for participants who only received six months of service. Nobody set out to compare mismatched things. The keys just were not there to stop it. The registry — the small, shared set of keys that both spend and outcomes are written against — is the thing you build once and reuse at every altitude. Most of that build is agreement, not software.
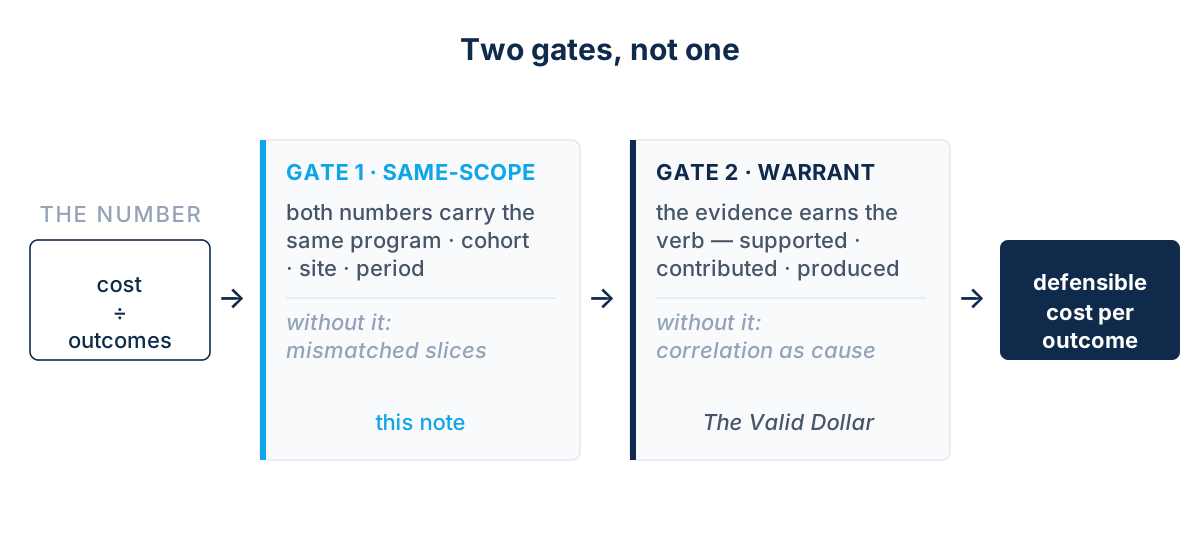
Whether the resulting number then earns a strong claim — supported, contributed to, produced — is a separate question, and it has its own answer in The Valid Dollar. The join makes the division same-scope. The warrant makes it honest about causation. They are two different gates, and a number needs both.
One join, three seats
Build the wire once and it pays out at every altitude. A program director reads one cohort and asks whether it is working; the join returns cost per outcome as outcomes mature, rather than at an annual post-mortem. A CFO reads across programs and asks where the next dollar goes; same-scope cost and outcome evidence gives that question a denominator instead of leaving it anchored to spend alone. The join does not make the allocation decision. Capacity, population difficulty, and strategy still sit on top of it. It makes the allocation question answerable. A board chair reads the same structure and can finally put a number to the donor’s question — what does a result cost here — that holds up, rather than an overhead ratio that does not. Three readers, three questions, one governed join.
Where to start
You do not rip out the finance system, and you do not wait for a perfect outcomes model. You decide one thing before anyone runs a report: every dollar and every outcome you intend to compare must be written against the same governed program, cohort, site, and period. Name those dimensions. Give the value lists one owner — and put that owner across both systems, not inside either, since a registry governed from the ledger bends toward what is easy to book and one governed from the program toward what is easy to report. Then hold one standing rule: a spend-only ratio never stands in as an effectiveness claim. That is the whole discipline, and it is cheapest to install at a migration, when the structure is still soft. It is the difference between two clean systems that cannot talk and one join that lets you reason about the next dollar instead of guess at it.
Written August 2026 for the Analytic Bytes Library. Standing practice: no client, employer or vendor is named in this piece. Companion to The Valid Dollar and The Reach Trap; the finance-side wire between them.
Questions, pushback, or a problem that looks like this one? Write to chai@analyticbytes.systems.